Water quality
- WATER QUALITY
Buzi
There are few systematic data on water quality in surface and underground watercourses in BuPuSa. Perhaps more comprehensive and more exhaustive studies of water quality in the Buzi Basin are from Steinbruch (2016) and Consultec (2015), referring to surveys on the physical-chemical and microbiological characteristics of surface water in the dry season, carried out during November 2016. These studies aimed at establishing the baseline for monitoring water quality, identifying possible regions with water quality problems at the sub-basin level, identifying possible anomalies in the composition of surface water and identifying strategic locations for the water quality monitoring.
Measured parameters included salts, pesticide contents, microbial load, metals, nutrients, turbidity, pH, Electrical Conductivity (EC) and dissolved oxygen (DO) at designated locations along the Buzi basin (Figure 5). Table 2 presents the results for pH, Turbidity, Total Coliforms, Ammonia, Nitrates and Phosphorus in Buzi catchment. The turbidity results indicated that the waters near the sources, e.g. near the Chimanimani, Station 25, and inside the Chicamba reservoir, Station 24, recorded low values (2.72-5.59 NTU), owing to pristine forest cover in the Chimanimani National Park, which consolidates soils for erosion and filters sediments, hence cleaner water, while waters coming from Zimbabwe to Chicamba, Station 26, had high turbidity values (80.21-879 NTU), probably due to intensive mining in the river bed coupled with poor forest cover in Zimbabwean side. The coliform level was relatively low, with the maximum in the high Revue, high Lucite and high Buzi zone being 101-240 CFU/100 ml. Water from Chicamba, Station 26, was more neutral, with pH 7.6-8.5, while water from Zimbabwe, Station 29, had a more acidic pH, with values 7.1-7.5. The Nitrate load was high in the water coming from the CNP and in the Chicamba reservoir (8-9 mg/L). Note that the whole scale of pH ranges from 0-14, with 7 being neutral. pH values less than 7 indicate acidity, while pH values greater than 7 indicate basicity. The natural turbidity of the waters is, generally, between 3 and 500 NTU; for potability purposes, it should be less than 1 NTU. The limit values for ammonia in drinking water are 0.25-32.5 mg/L. The safe level of nitrate in drinking water is 10 mg/L. Natural phosphate levels generally range from 0.005 to 0.05 mg/L.
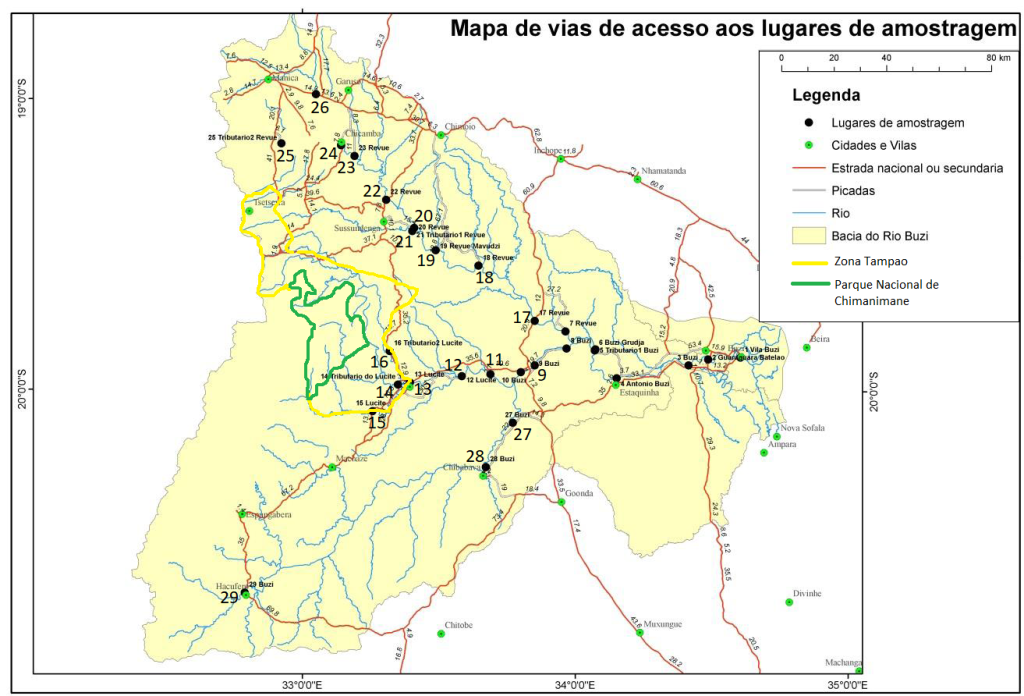
Figure 5: Places where the measurement of water quality indicator parameters was carried out in Buizi river catchment (source: Steinbruch, 2016).
Table 2: pH, turbidity, microbial and nutrients in water courses in Buzi river catchment (Steinbruch, 2016).
| Sub-basin | Station | Local | pH | Total coliforms [UFC/100 ml] | Turbidity [NTU] | NH4 [mg/L] | N03 [mg/L] | P [mg/L] |
| High Revue | 19 | 7.6-8.5 | 1-100 | 2.72-5.59 | 7 | |||
| 20 | 7.6-8.5 | 1-100 | 2.72-5.59 | 7 | ||||
| 21 | 7.1-7.5 | 1-100 | 47.61-80.20 | 7 | ||||
| 22 | 7.1-7.5 | 101-240 | 47.61-80.20 | 8 | ||||
| 23 | 7.1-7.5 | 1-100 | 2.72-5.59 | 8 | ||||
| 24 | Chicamba reservoir | 7.6-8.5 | 1-100 | 2.72-5.59 | 9 | |||
| 25 | Entrance of the Chicamba reservoir from Zimbabwe | 7.1-7.5 | 101-240 | 2.72-5.59 | 2 | |||
| 26 | Entrance of the Chicamba reservoir from Chimanimani Park | 7.6-8.5 | 101-240 | 80.21-879 | 8 | |||
| High Lucite | 13 | 6.5-7.0 | 101-240 | 47.61-80.20 | ||||
| 14 | 6.5-7.0 | 1-100 | 2.72-5.59 | |||||
| 15 | 6.5-7.0 | 101-240 | 47.61-80.20 | |||||
| 16 | 6.5-7.0 | 101-240 | 47.61-80.20 | |||||
| High Buzi | 29 | 7.6-8.5 | 1-100 | 2.72-5.59 | 1.1 | 8 | 0.1 |
Table 3 presents the concentration of some heavy metals in Buzi river catchment, according to surveys carried out by Steinbruch (2016). Relatively high concentrations of heavy metals, Ni (0.80 mg/L), Cu (0.30 mg/L), Zn (0.10 mg/L), Pb (0.008 mg/L) and Titanium (0.002 mg/L) L), were recorded in the tributaries that feed the Chicamba Reservoir, coming from the Chimanimani national park and its buffer zone, while the concentration of heavy metals from tributaries that enter the Reservoir from Zimbabwe is relatively low.
Table 3: Concentration of heavy metals in water courses in Buzi catchment (Steinbruch, 2016). Values highlighted in red exceed WHO limits.
| Sub-basin | Station | Local | Ni [mg/L] | Cu [mg/L] | Zn [mg/L] | Pb [mg/L] | Titanium [mg/L] |
| High Revue | 19 | 0.001 | 0.008 | ||||
| 20 | 0.002 | 0.004 | |||||
| 21 | 0.009 | 0.002 | 0.007 | ||||
| 22 | 0.002 | 0.020 | |||||
| 23 | 0.002 | 0.003 | |||||
| 24 | Chicamba reservior | 0.002 | 0.002 | ||||
| 25 | Entrance to the Chicamba reservoir from Zimbabwe | 0.009 | 0.003 | 0.009 | |||
| 26 | Entrance to the Chicamba reservior from Chimanimani park | 0.080 | 0.030 | 0.1 | 0.008 | 0.002 | |
| High Lucite | 13 | 0.002 | 0.001 | 0.01 | |||
| 14 | 0.003 | 0.003 | 0.02 | ||||
| 15 | 0.002 | 0.01 | |||||
| 16 | 0.003 | 0.004 | 0.004 | 0.007 | |||
| High Buzi | 29 | 0.003 | 0.002 |
According to Global Water Partnership news, released in 19th August 2022 (GWP, 2022) the Zimbabwean side of the Buzi basin was heavily exploited for agriculture and related activities, while the mid and lower reaches of the basin in Mozambique was not as intensively utilised compared to the Zimbabwean side. On the other hand, recent studies conducted by BIOFUND (BIOFUND 2022) have indicated that in the upper Buzi, the ecosystems and hence the water quality is pristine, due to the fact that there is a National Park, The Chimanimani National Park in which the ecosystems are preserved. Climate Resilience Infrastructure Development Facility report (CRIDF, 2015) indicated that the Buzi River was moderately polluted with fertilisers, pesticides and herbicides, used on both small- and large-scale farms in the Basin. However, artisanal gold mining activity was identified as the major source of pollution for both the surface and groundwater courses (GWP, 2022). There are several small-scale mining projects in the Buzi catchment, especially in Upper Revue, where gold and greenstones (such as Cu, Fe, Al) are mined in the river beds (Consultec, 2015). Other activities with adverse effects on water quality identified included were inadequate cultivation in slope ground and deforestation, which were said to have led to soil exposure to erosion, land degradation, and consequent increased sediment loads in surface water courses (GWP, 2022).
Thus, the major water quality issues in the Buzi basin are nutrient enrichment from agricultural activities, pollution from gold mining activities (especially artisanal gold panning) and changes in sediment load, due to inadequate land use and management (Consultec, 2015).
Pungwe
The water quality in the upper reaches of the Pungwe River in Zimbabwe is almost pristine because there is national park, the Nyanga National Parks where human settlements are forbidden by law (GoM, 2006). For the rest of the catchment, water quality is influenced by human settlements, agriculture, afforestation, gold panning and salt water intrusion. Although the latter is a natural phenomenon, it can be exacerbated by high abstraction of water from the river during the low flow season.
Despite the water quality in Pungwe is considered reasonably good (Consultec, 2013), there were records of high levels of pollutant contaminants, though within acceptable ranges, and these were turbidity in Nyamukwara and Nyamukombe catchments, high iron content in Nyamhingura, Ruda and Honde and high zinc content in Ruda and Nyamhingura. There were records of high content TSS, COD and BOD in whole the extension of Pungwe basin (Conusltec, 2013).
In all these, the alluvial gold mining in the Nyamukwarara, Nyamukombe and Nyamhingura rivers are the most significant source of pollution (GoM, 2006). Figure 6 shows the location of the main gold mining. The inadequate cultivation practices in sloping ground and deforestation are other source of pollution to be considered, as they exposure the soil to erosion, and thereon causing increased sediment load and siltation in the river and lakes.
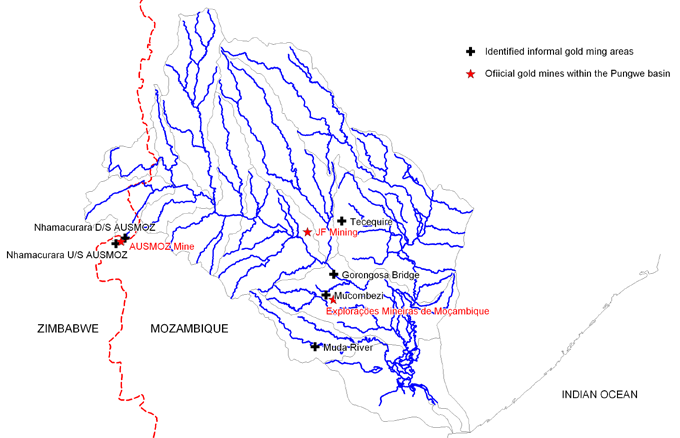
Figure 6: Location of gold mines in Pungwe river (Source: GoM, 2006)
Save
The water quality in Save and its tributaries is mostly affected by: inadequate sanitation in the main cities and villages (ZWF, 2014), industrial effluents and alluvial mining. The resulting contaminants enters the natural river water courses as point and diffuse sources. Point sources are mainly from urban and industrial drainage (ZWF, 2014)) and artisanal mining, whereas the diffuse sources are largely from agricultural runoff and artisanal mining. Siltation, due to excessive sediment load, bought by soil exposures due to deforestation is also one of the sources of pollution reported in the natural water courses in save catchment, where the western drier lands show large amounts of siltation and the astern highlands have cleaner water because of high runoff available and because of the protection provided by the national parks that are there.
Water quality in the Save catchment is reasonably monitored on the Zimbabwean side, with 20 parameters being measured compared to the Mozambican side, where only at one station, near the Bridge in Vila Franco do Save, at lower Save is monitored. Studies conducted in the Zimbabwe side of the basin, in Odzi (Table 4) and Runde (Table 5) rivers, as measured in Abril-May 2013, at stations indicated in Figure 7, where values highlighted in red exceed WHO limits. In Runde, the concentration of iron exceed the World Health Organization (WHO) standards in all stations. (Hydroconsult, 2017) have indicated high values of Alkanity, COD, Iron, Manganese, Phosphate and TSS.
Artisanal mining activity remain the main source of pollution in save catchment, according to Murwira at al. (2014) and Lupankwa et al. (2006), whose studies recorded high concentrations of (Fe), nickel (Ni), copper (Cu), cobalt (Co), lead (Pb), zinc (Zn), and sulphate ions (SO42-).
Table 4. Chemical parameters of surface water sampled in Save and in Runde catchments, a tributary of save in Zimbabwe, measured in Abril-May 2013. Values highlighted in red exceed WHO limits.
| Parameter | Range |
| BOD | <2-36.8 mg/L |
| COD | <1-109 mg/L |
| DO | 66.6-226.9 µg/L |
| Cl | 11-58.2 %0 |
| Cu | 0.01-0.02 mg/L |
| NO3 | 0.55-1.46 mg/L |
| TSS | 2-462 mg/L |
| Fe | 0.02-3.37 mg/L |
| Cu | 0.01-0.02 mg/L |
| Mn | 0.01-0.28 mg/L |
| Ni | <0.01 mg/L |
| Zn | <0.01-0.02 mg/L |
In Mozambique side, water quality monitoring was conducted in single station, at Vila Franco de Save, at lower save (Hydroconsult, 2017). Nitrates (NO3) and nitrites (NO2) were less than 10 mg/L and about 0.07 mg/L, respectively; Chlorides varied in the range 2.8-205.6 mg/L; Alkalinity varied in the range 26-172 mg/L; and Faecal coliforms varied in the range <3 to 460 ufc/100 mL (Hydroconsult, 2017). Total Suspended Solids (TSS) was above the accepted level, which may be attributed to poor land use practices, which causes erosion and artisanal mining. Unfortunately, in Mozambique side there is monitoring of heavy metals.
Table 5: Chemical parameters of surface water sampled in Save and in Runde catchments, a tributary of save in Zimbabwe, measured in Abril-May 2013. Values highlighted in red exceed WHO limits.
| Catchment | Station | Chloride [mg/L] | Sulphate [mg/L] | Nitrate [mg/L] | Ammonia [mg/L] | Fe [ppm] | Ni [ppm] |
| Save | CHIPIN | 21.3 | 11.8 | 0.204 | 0.012 | 0.68 | N/D |
| Save | DTZ 1 | 7.1 | 112.8 | 0.003 | 0.014 | 0.53 | N/D |
| Save | EL 2 | 21.3 | 144.2 | 0.032 | 0.027 | 1.39 | N/D |
| Save | EPR 106 | 7.1 | 74.5 | 0.041 | 0.025 | 1.50 | N/D |
| Save | ER 13 | 14.2 | 48.3 | 0.007 | 0.015 | 1.67 | N/D |
| Save | ER 13 A | 35.5 | 30.3 | 0.003 | 0.106 | 2.30 | N/D |
| Save | ER 49 A | 7.1 | 19.9 | 0.005 | 0.014 | 0.94 | N/D |
| Save | ER 56 A | 7.1 | 12.6 | 0.034 | 0.015 | 0.37 | N/D |
| Save | ER 86 A | 63.8 | 49.2 | 0.165 | 0.103 | 0.99 | N/D |
| Runde | EL 7A | 7.1 | 23.4 | 0.024 | 0.011 | 0.10 | N/D |
| Runde | ER 118C | 7.1 | 24.2 | 0.007 | 0.014 | 0.11 | N/D |
| Runde | ER 1A | 70.9 | 15.2 | 0.054 | 0.010 | 0.45 | N/D |
| Runde | ER 30A | 14.2 | 0.0 | 0.009 | 0.010 | 0.55 | N/D |
| Runde | ER 3A | 21.3 | 16.9 | 0.007 | 0.011 | N/D | N/D |
N/D: stands for not detected. Values in red had exceed the WHO standards (source: Murwira et al. (2014)).
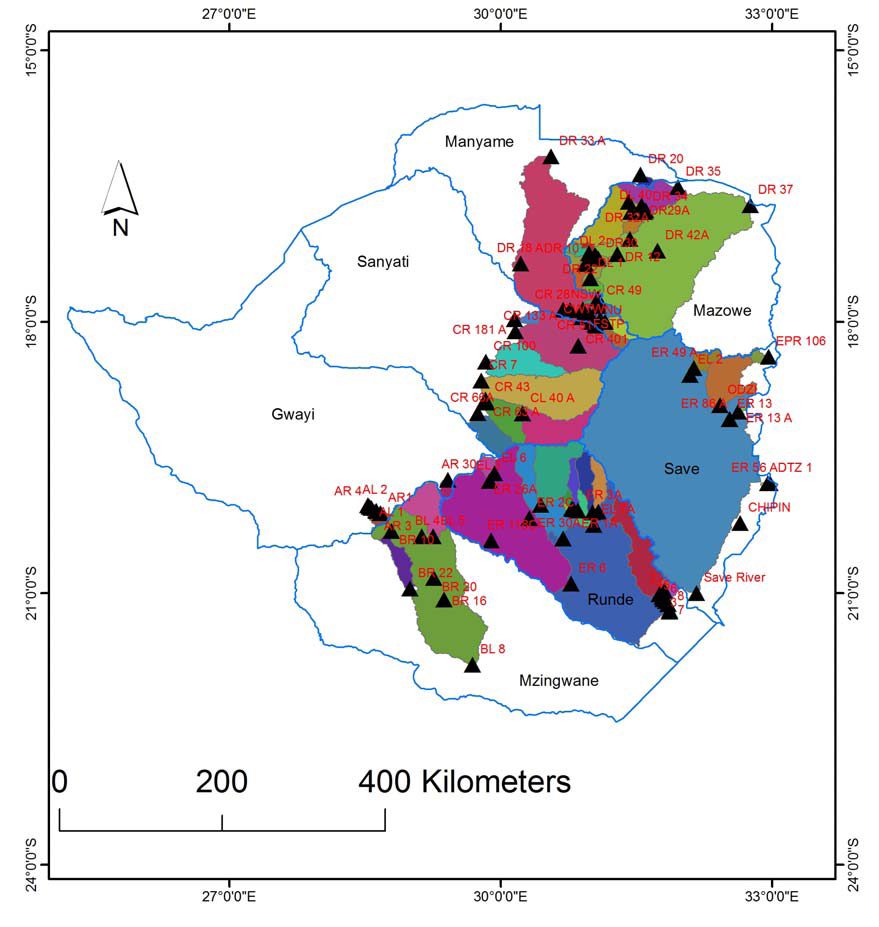
Figure 7: Location of the water quality determination stations in the catchment in Zimbabwe. Attention is drown to Save and in Runde catchments (a tributary of Save Siver) (Murwira et al., 2014).