Climate in the Basins
The average annual rainfall is 1050 mm/yr for the Pungwe Basin, 1085 mm/yr for Buzi Basin, and 715 mm/yr for the Save Basin. Within the Pungwe Basin average annual rainfall ranges from 900 mm/yr in the Urema Sub-basin located on the lower eastern part to 2000 mm/yr over the Nyanga Mountains in Zimbabwe (Figure 2). The Buzi Basin has a similar spatial pattern of rainfall with the Lower Buzi Sub-basin receiving 900 mm/yr and the Upper Lucite Sub-basin which drains the Chimanimani Mountains having an average rainfall of 1300 mm/yr. There is considerable spatial variability of rainfall over the Save Basin. Rainfall increases from about 550 mm/yr on south-western parts to 900 mm/yr on the northern parts, and to 1200 mm/yr over the Odzi Sub-Basin on the north-eastern part of the Save Basin (Figure 2).All the three basins have high interannual variability of rainfall irrespective of whether a location receives low or high rainfall (Figure 3). In some years, the annual rainfall received can be as low as 50% to 60% of the long-term average annual rainfall or as high as 120% to 150%. The BUPUSA basins are frequently affected by tropical storms and cyclones which have significant effects on rainfall received and river flows including flooding. On average the Pungwe and Buzi Basins are affected by a tropical storm every year, and a cyclone once in three years, all which originate from the South-West Indian Ocean. During some of the severe cyclones such as Eline in 2000 and Idai in 2019 up to 200 – 400 mm of rainfall can be received within 1 to 2 days resulting in severe flooding and landslides in mountainous areas. Cyclone Idai caused deaths of over 700 persons, displaced 400,000 persons, and affected over 1.5 million in Mozambique and Zimbabwe.
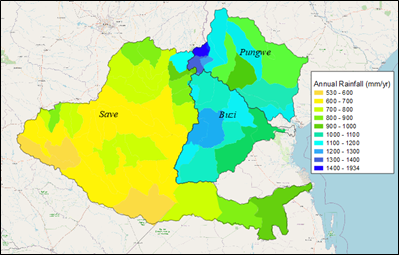
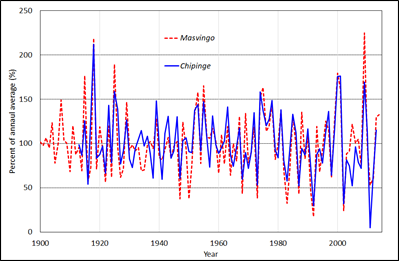
Figure 2: Spatial variation of average annual rainfall within the Save, Buzi and Pungwe Basins
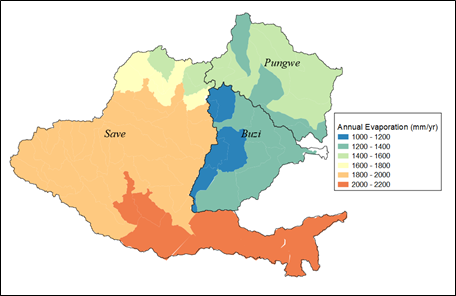
Figure 3: Annual rainfall expressed as a percentage of mean annual average rainfall for Chipinge (1086 mm/yr) and Masvingo (633 mm/yr) The relatively humid and cool to warm conditions in most parts of the Pungwe and Buzi Basins lead to low pan evaporation rates, 1000 – 1400 mm/yr (Figure 4). The Save Basin in contrast has a warm and dry climate, hence pan evaporation are generally in the 1800 – 2000 mm/yr range. These high evapotranspiration rates substantially affect the availability of water resources particularly in surface water bodies. Most dams will lose about 10% to 20% a year of the water stored due to evaporation and reduces the reliable water yield. The design of storage capacities of dams in the BUPUSA has to be increased to overcome the adverse effects of evaporation. Figure 4: Relatively low evaporation rates within the Pungwe and Buzi Basins, while high rates occur in the Save Basin.