Current Water Uses as of 2023
Buzi Basin
The total amount of water currently used (2020) in the Buzi Basin is 339 Mm3/yr. Irrigation accounts for 81% of the water demand. Water supply to the following urban centres Chipinge and Chimanimani (Zimbabwe), Chimoio, Manica and Gondola (Mozambique) is the second largest water user (Figure 9) (Consultec, 2015). During previous studies on water use in the Buzi Basin, the amounts of water consumed by plantation forests were not included because the effects were assumed to be reflected in the estimated MAR. Since these plantations were established a long time ago, the effects on river flows are reflected in the MAR. While not included in Table 5, plantation forests are estimated to utilise 45 Mm3/yr and 30 Mm3/yr in Zimbabwe and Mozambique respectively.
Table 5: Estimated current (2020) water demand (Mm3/yr) by the various sectors in the Buzi Basin
| Sub-basin | Rural | Urban | Livestock | Irrigation | Industrial | Total | % of Basin Total |
| Revue Zimbabwe | 0.32 | – | 0.29 | 61.00 | 2.40 | 64.01 | 19.1 |
| Lucite Zimbabwe | 1.75 | 0.64 | 0.38 | 89.00 | 1.50 | 93.27 | 27.9 |
| Buzi Zimbabwe | 2.44 | 2.35 | 1.31 | 103.00 | 2.00 | 111.10 | 33.2 |
| Sub-total ZWE | 4.51 | 2.99 | 1.98 | 253.00 | 5.90 | 268.38 | 80.3 |
| Upper Revue | 0.96 | 28.40 | 0.36 | 2.00 | 0.50 | 32.22 | 9.6 |
| Middle Revue | 0.67 | – | 0.34 | 2.00 | 0.30 | 3.31 | 1.0 |
| Lower Revue | 0.67 | – | 0.41 | 3.00 | 0.40 | 4.48 | 1.3 |
| Upper Lucite | 0.54 | – | 0.47 | 1.00 | 0.20 | 2.21 | 0.7 |
| Lower Lucite | 0.54 | – | 0.23 | 1.00 | 0.10 | 1.87 | 0.6 |
| Upper Buzi | 0.93 | – | 0.63 | 1.00 | 0.20 | 2.76 | 0.8 |
| Middle Buzi | 0.72 | – | 0.47 | – | 0.30 | 1.49 | 0.4 |
| Lower Buzi | 0.72 | – | 0.25 | 14.00 | 2.70 | 17.67 | 5.3 |
| Sub-total MOZ | 5.73 | 28.40 | 3.16 | 24.00 | 4.70 | 65.99 | 19.7 |
| TOTAL | 10.24 | 31.39 | 5.14 | 277.00 | 10.60 | 334.37 | 100.0 |
The urban sector in Zimbabwe is the largest water user (43%) followed by crop irrigation (Figure 9)
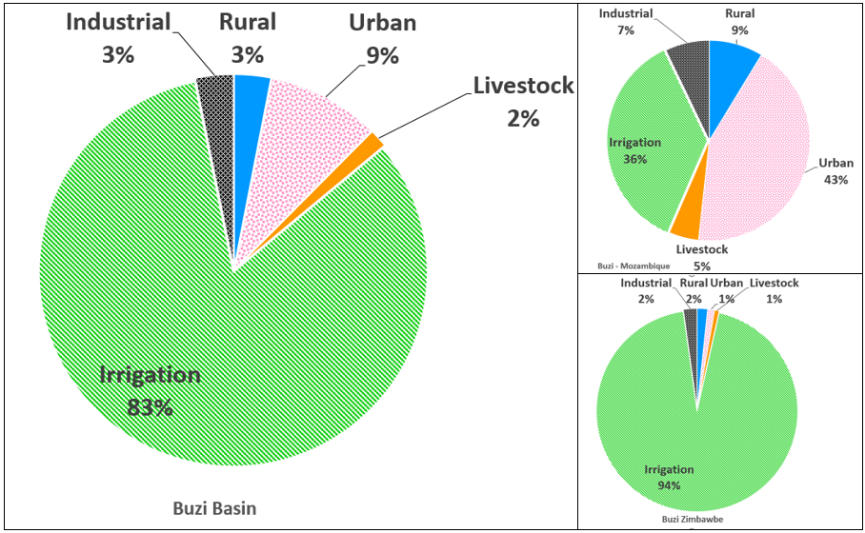
Figure 9: Contribution of the various sectors to water demand in Buzi Basin
Pungwe Basin
The estimated total water use in 2020 in the Pungwe Basin is 808 Mm3/yr (Table 4) with crop irrigation accounting for 67% of this amount, followed by the urban sector, 25% (Figure 8) (Consultec, 2013) . Irrigation of sugar cane plantations in the Lower Pungwe Sub-basin, e.g. Mafambisses, use most of the water taken by the irrigation sector. The City of Mutare in Zimbabwe meets part of the water requirements from the Pungwe Basin. This is done by diverting 0.7 m3/s upstream of the Pungwe Falls into a 4 km tunnel and then a 46 km pipeline to this city. Beira and Dondo are the major urban settlements depending on the Pungwe Basin for water supply. Several major rural settlements like Hauna in Zimbabwe, Catandica and Gorongosa in Mozambique are significant users of water.
Table 4: Current water uses (Mm3/yr) by various sectors in the Pungwe Basin
| Urban | Rural Water | Irrigation | Livestock & Tourism | Industry | Total | % of Total | |
| Pungwe Zimbabwe | 112 | 66 | 177 | 22 | |||
| Honde Zimbabwe | 11 | 42 | 53 | 7 | |||
| Sub-total ZWE | 112 | 11 | 107 | – | – | 230 | 28 |
| Upper Pungwe | 5 | 5 | 1 | ||||
| Nyazonia | 75 | 75 | 9 | ||||
| Middle Pungwe | 9 | 44 | 5 | 32 | 90 | 11 | |
| Muda | 34 | 34 | 4 | ||||
| Lowe Pungwe | 92 | 276 | 7 | 375 | 46 | ||
| Sub-total MOZ | 92 | 9 | 434 | 5 | 39 | 579 | 72 |
| TOTAL | 203 | 20 | 541 | 5 | 39 | 808 | 100 |
Water used for rural water supply and livestock watering amount to 3% of the total water use in the Pungwe Basin (Figure 8).
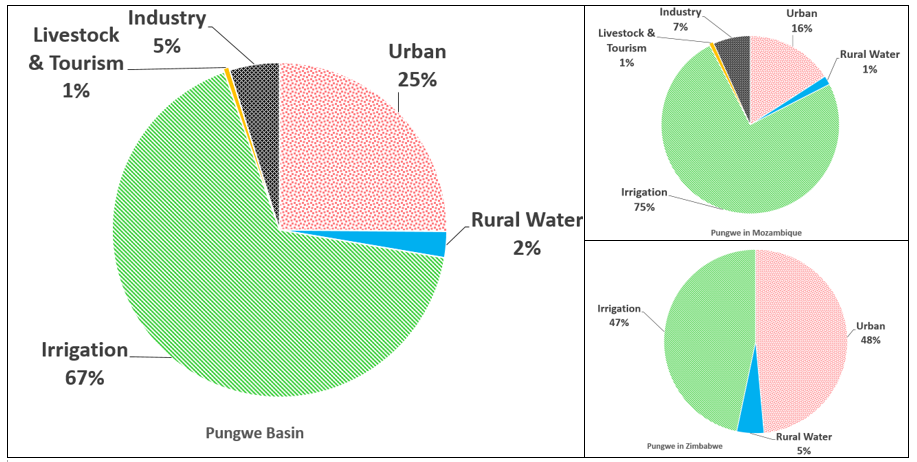
Figure 8: Contribution to water use by the various sectors in the Pugwe Basin.
Save Basin
The estimated current water use in the Save Basin is 7844 Mm3/yr and Zimbabwe accounts for 98% of this amount (Table 6). Crop irrigation is the largest consumer of water amounting to 91% of the total water use at the basin level (Figure 10). In Mozambique water for crop irrigation accounts for 61% of the Save water used in this country. Water uses in the Runde Sub-basin in Zimbabwe which has very large dams such as Tokwe-Mukosi (1802 Mm3), Mutirikwi (1378 Mm3) account for about 70% of the total water used in the Save Basin.
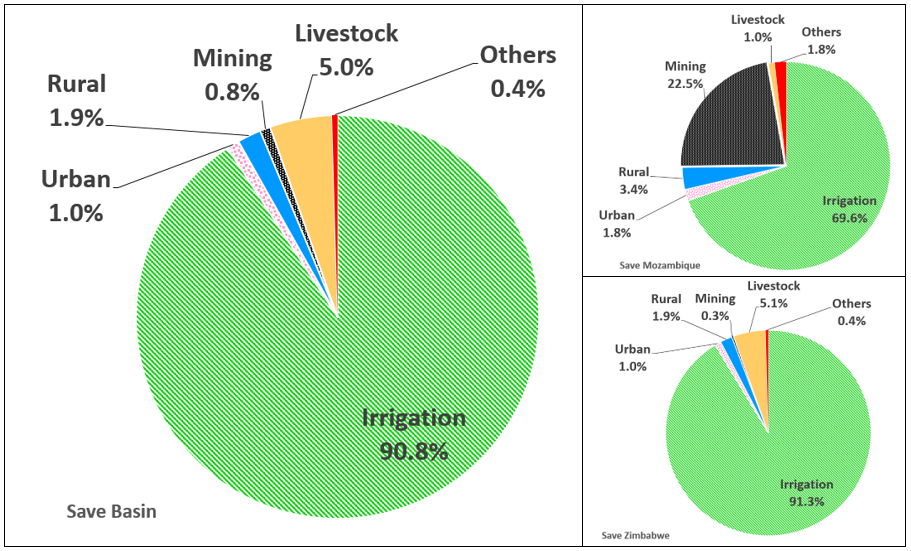
Figure 10: Contribution of the sectors to water use in the Save Basin
Table 6: Estimated amounts (Mm3/yr) of water used by the various sectors in the major sub-basins of the Save Basin.
| Sub-basin | Irrigation | Urban | Rural | Mining | Livestock | Others | Total | % of Basin Total |
| Save Zim | 1 838 | 14 | 81 | 5 | 210 | 25 | 2 174 | 28 |
| Runde | 5 190 | 63 | 54 | 16 | 153 | 4 | 5 480 | 70 |
| Sub-total ZWE | 7 029 | 77 | 134 | 21 | 363 | 29 | 7 653 | 98 |
| Massangena | 43 | 4 | 3 | 40 | 1 | 3 | 93 | 1 |
| Covanne & Estuary | 94 | 3 | 1 | 97 | 1 | |||
| Sub-total MOZ | 137 | 4 | 5 | 40 | 2 | 3 | 191 | 2 |
| Basin Total | 7 165 | 81 | 140 | 61 | 365 | 32 | 7 844 | 100 |